Air Quality Impact
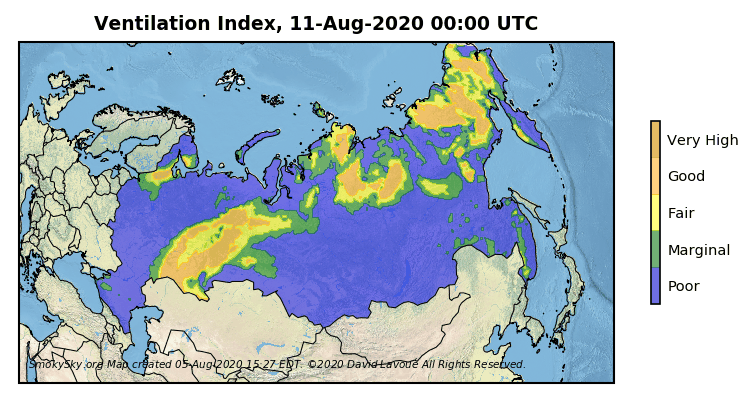
Ventilation Index
Atmospheric pollutants emitted by wildland fires disperse by mixing with the surrounding air. The dispersion process, also called ventilation, depends on wind speed and direction, turbulence, and smoke plume rise. To assess the dispersion efficiency one can calculate the ventilation index by multiplying the wind speed by the mixing height. The latter corresponds to the height of vertical mixing of air above ground.
|
|
|
Health Effects
Populated areas can experience episodic wildfire smoke events associated with sharp increases in particulate matter concentrations. Sometimes persistent synoptic flow can keep smoke at the surface for longer periods of time. Aerosol concentrations can then reach dangerous levels of several hundreds of µg/m3 and will only return to normal when the weather pattern changes significantly.
|
Wildfire smoke causing poor air quality and reduced visibility in Calgary on May 16, 2023. (video courtesy of A. Chowdhury). |
PM2.5 levels observed during the 2017 California fires were similar to the concentrations measured in the heavy polluted city of Beijing, China. However, the chemical characteristics of the smoke produced by wildfires differ from these of ambient air pollution in cities and makes it very harmful to human health.
A comprehensive study of hospital admissions during fire events [Liu et al., 2015] indicates a significant increase in hospitalizations during and just after exposure to wildfire smoke. High PM2.5 concentrations are associated with acute respiratory problems, especially among elder people and infants. Evacuation measures may be necessary to reduce exposure to heavy smoke.
Smoke Monitoring & Air Quality Measurements
Satellite visible imagery provides an incredible view of smoke plumes from space. Remote sensing constitutes a great tool to determine the predominant direction of the long-range transport of smoke. In addition, ground-based measurements performed at air quality monitoring stations record concentrations of various atmospheric pollutants and can point out the impact of smoke on surface-level air quality.
|
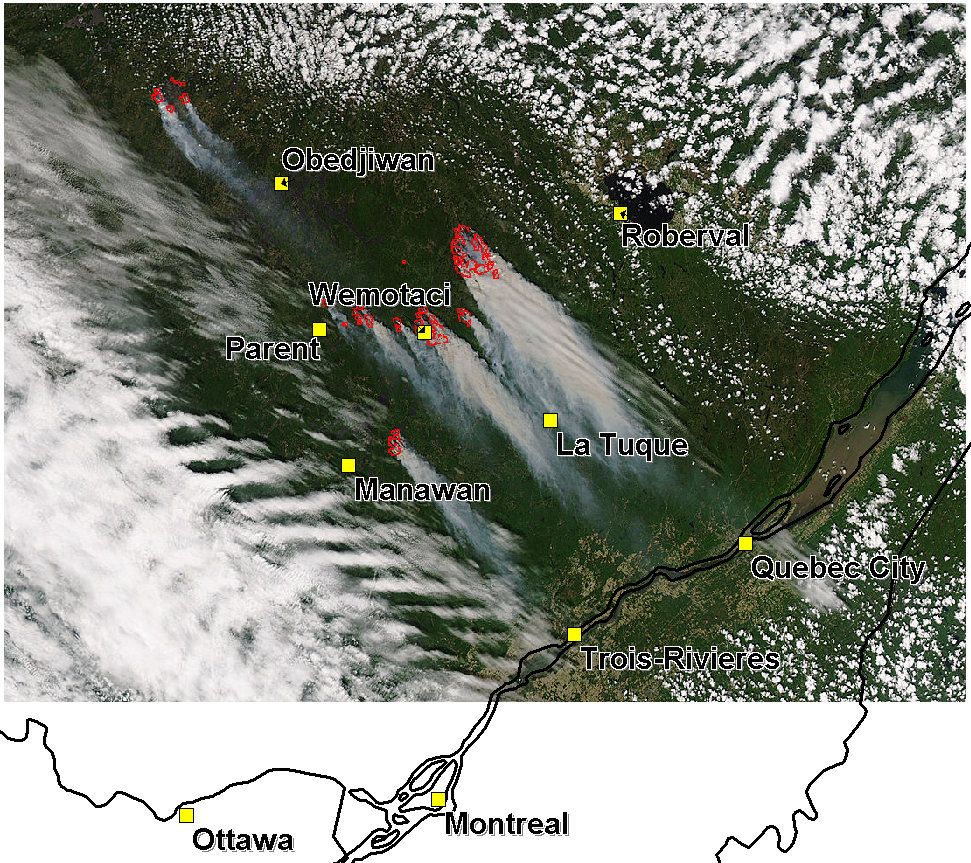
Detection of smoke plumes by satellite end of May 2010 over southern Quebec, Canada |
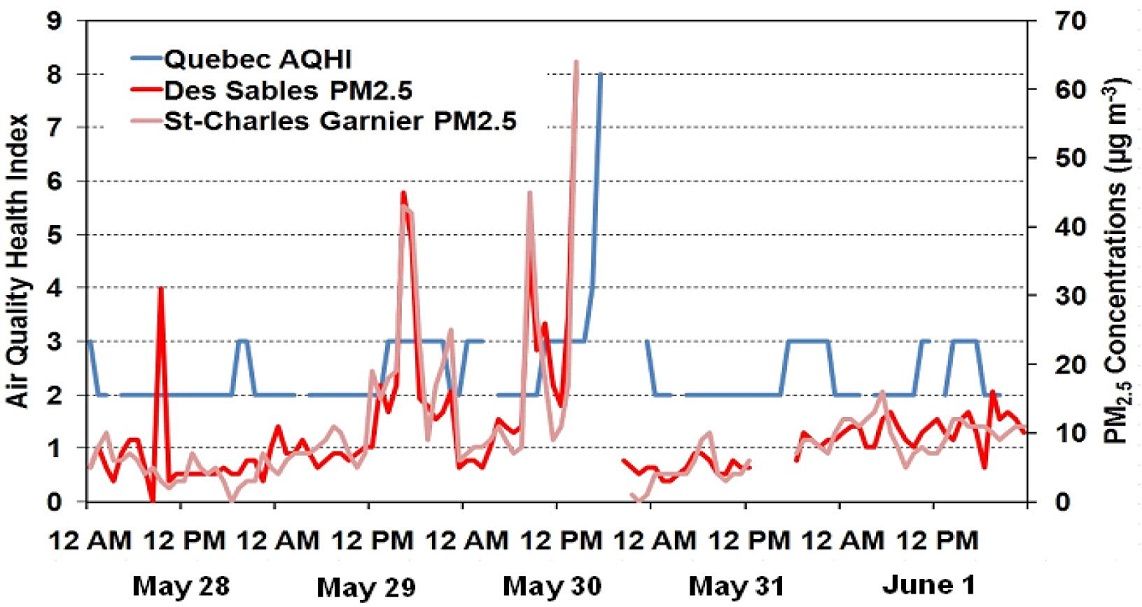
Impact of fire smoke on air quality in Quebec City, Canada. |
Numerical Modeling
The impact of smoke plume dispersion on ambient air quality can be simulated with computer models, a.k.a. numerical models, driven by emission and meteorological inputs. The two main types of models are Lagrangian and Eulerian.
Lagrangian models, such as FLEXPART and HYSPLIT, follow parcels of smoke as they move. They help to perform an hourly analysis of the atmospheric transport patterns of fire smoke by prevailing winds. As an example, the animation on the left was extracted from a FLEXPART simulation using black carbon emission point sources and ECMWF (European Centre for Medium-Range Weather Forecasts) meteorological fields for western Canada. The one on the right was obtained from a smoke simulation conducted with HYSPLIT.
|
Simulation of smoke plume transport from the 2003 British Columbia fires with FLEXPART. |
Simulation of smoke plume transport from the 2010 Quebec fires with HYSPLIT. |
On the other hand, Eulerian models, a.k.a. Chemical Transport Models (CTMs) are comprehensive 3-dimensional models simulating chemical and physical processes affecting species in smoke plumes in a gridded domain. Such models include Environment Canada's former air quality model CHRONOS and the state-of-the-art U.S. WRF-Chem model which has been developed jointly by various weather and atmospheric research organizations and laboratories.
|
Simulation of smoke plume transport from the 2002 Quebec fires with CHRONOS. |
Simulation of smoke plume transport from the 2010 Quebec fires with WRF-Chem. |
Last Modified on 3 May 2021